Customer Segmentation Studies
For more than 33 years Cascade professionals have performed a variety of advanced segmentation studies for clients, spanning the full range of methodologies including:
- Behavioral
- Attitudinal
- Demographic
- Lifestyle-based
- Values-based
- Needs-based
- Media-based
- Product/service usage-based
- Purchase intent based.
Advanced segmentation studies conducted by Cascade have used a variety of input data sources including:
- Self-reported survey data from telephone, mail, in-person, and web interviews.
- CRM or data-warehouse customer data, with or without external appends.
- Campaign data, including gross mail file and responder subfiles.
- Intercept data from retailers, restaurants, supermarkets, and the like.
- Warranty cards and product registration data.
- Customer satisfaction scores and raw data.
- Revenue, profit, cost, and other financial data.
Partial list of segmentation clients
An excerpted listing of clients for whom we have conducted advanced segmentation studies includes:
- Agilent Technologies
- Altrec.com
- American Express Travel Source
- AnchorDesk.com
- AT&T
- AT&T Wireless
- Briazz
- BuildServ.Com
- Cellular One
- Citicorp WorldLink
- Cucina! Cucina! Restaurants
- drugstore.com
- Emerald Solutions
- Enlight Network
- Ernst & Young E*Trade
- Essential Markets
- Expedia
- Flexcar
- Global Mobility Systems
- GTE Mobilnet
- Hewlett-Packard
- Icom
- ICT
- Imandi.com
- InterDev
- Isomedia
- Keystroke Financial
- LibertyBay.com
- MA Network
- Mercata
- Microsoft Corporation
- MSDN/Microsoft Developer Network
- Microsoft Business Software Alliance
- NetCommerce
- NetStock Direct
- Onyx Software
- Play Network, Inc.
- PowerPick, Inc.
- Publix Supermarkets
- Rapid Responder
- ShareBuilder/NetStock Direct
- Snapper Lawn Mower Company
- SolutionsIQ
- Speakeasy.com
- SPRINT
- SPRINT PCS
- Sun Microsystems
- Sybase
- Ticketmaster
- T-Mobile/VoiceStream Wireless
- Toll Free Cellular
- VenuePop
- VTech Communications
- Wall Data
- Western Wireless
- Winebid.com
- World2Market
- XYPOINT
- Yesler Software
The Cascade difference in segmentation
Cascade Strategies has successfully employed both traditional and state-of-the-art segmentation architectures, including genetic algorithms, back propagation, self-organizing mapping, hierarchical clustering, K-means clustering, CHAID, CART, QUEST, sometimes assisted in the preprocessing phase by factor analysis, ANOVA, and discriminant analysis, depending on the style of input dataset we receive.
But going further, Cascade strongly distinguishes itself from other research firms conducting segmentation studies in the following ways:
- Better ability to develop insights for communications. While Cascade personnel have extensive left-brain skills that enable them to do a superior job of analyzing the primary data for the segmentation and preparing the master typology for the brand, they also have extensive right-brain skills developed through years of executive-level experience at leading communications firms and advertising agencies. The ability to call on well-developed sets of both linear and creative skills has helped Cascade achieve significant breakthroughs for clients in interpreting the sometimes complex findings of quantitative segmentation studies, rendering these interpretations in terms that everybody can understand and use, and developing imaginative communications strategies that are both effective and profitable. Cascade personnel regularly draft and present prospective creative briefs for advertising and website development.
- Pragmatic outcomes. One of the greatest failings of segmentation studies in general, according to Wade Boudreaux of Quirk’s Marketing Research Review, is not that they are inherently badly done, but that they are too esoteric to apply to the real work of companies. Cascade does not fail in this respect. Cascade has developed a strong reputation for preparing brand typologies that are easy to understand and apply. Further, Cascade personnel use ordinary language and simple, straightforward graphic tools to describe to non-research people what the segmentation study has discovered about customers and prospects. The section below entitled “An example of attitudinal segmentation” discusses some of the graphic tools used to describe the findings of our segmentation studies.
- The ability to empirically extend the results into effective geographic and media analyses.Many research firms that conduct segmentation studies prepare the typology and the report, then stop, because their skills and resources end there. This is not true of Cascade Strategies. We fully understand how to empirically transform the results of segmentation into further practical analyses that help answer key questions for the brand such as:
- Where do the best prospects live, “best prospects” being defined by the segmentation itself? In what cities, places, and neighborhoods are the best prospects most heavily concentrated? For example, for SquareSoft and ShareBuilder, we prepared a prioritized list of US DMA’s on the basis of their indices of concentration, so brand and media planners could target the right markets for acquisition efforts and new-product introductions.
- What media are best customers and prospects most attentive to, “best customers and prospects” being defined by the segmentation itself? Where do the different types as discovered by the segmentation gather information about the category, and what media are dominant in this respect? Cascade Strategies has extensive experience in extending the results of segmentation into the arena of media habits. For example, for clients Publix Supermarkets and Snapper Lawn Mowers, Cascade provided weighted-algorithm outputs to Nielsen to enable them to prepare customized psychographic media-habits tables for the media director to use alongside the traditional indexed demographic tables in setting an annual media plan for the brand.
An example of attitudinal segmentation
To give you some idea of how we work, it may be helpful to provide a few examples of output in the case of an attitudinal segmentation study. This example deals generally with “Internet communications.”
Let’s say, for example, that in a phone or web survey we had asked respondents questions about:
- Demographics (age, gender, income, kids, etc.)
- Psychographics (personality traits, outlooks, beliefs, etc.)
- Needs/Motivations
- Media (websites, magazines, radio, TV)
- Behaviors (with regard to this brand and other brands)
- Attitudes (toward this brand and other brands).
We would begin by preprocessing the variables for submission to classification modeling. We would then test and train a number of modeling techniques on the transformed dataset to discover which methodology performs optimally. These techniques may include genetic algorithms, back propagation, self-organizing mapping, hierarchical clustering, K-means clustering, CHAID, CART, QUEST, or other techniques.
We would return the n-group solution which is most coherent, easiest to understand and describe to non-technical audiences, and produces the greatest distinctions among the types. We would provide appropriate names for the types to assist understanding and application of the results.
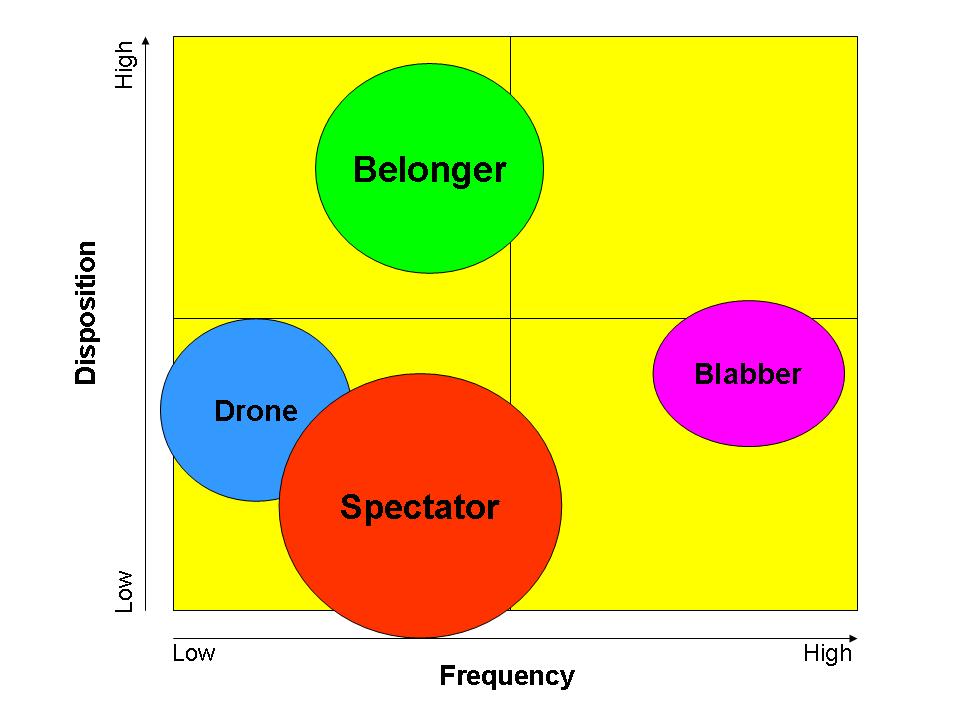
Since the resulting market typology would be, at root, an attitudinal typology, the names chosen would be reflective of the fundamental attitudes of each type with reference to the brand. Here is an example of a purely hypothetical outcome so you can understand the overall approach we typically take. (We emphasize: this is purely hypothetical.)
In this purely hypothetical example, the Blabber may have a tendency to gab online a good deal (e.g., via chat, Instant Messaging, email, etc.) – his/her frequency is high. But the Blabber’s desire to use our brand, per se, as a means to do this is low – his/her disposition toward the brand is only moderate.
By contrast, the Belonger would be highly disposed by attitude and outlook to use our brand’s product as a way to communicate – if only he/she actually engaged in more of that type of communication (his/her frequency is only moderate). (The word “Belonger” is used to suggest that the person might enjoy such communication because belonging is an important need; but he/she simply hasn’t discovered yet how enjoyable our brand’s form of communication might be.)
By further contrast, the Drone and the Spectator might have low-to-moderate frequency in the category and disposition toward our brand – the Drone because he/she perhaps does little in the way of communicating at all and the Spectator because he/she may be communicating a bit more frequently, but his/her likelihood to use our brand’s tools and services to do so is the lowest among all the types.
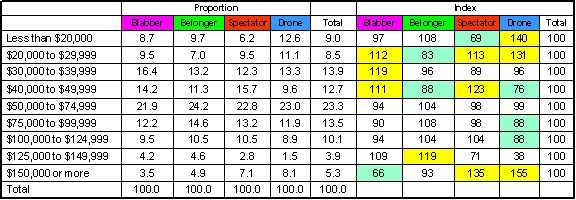
Tabular output
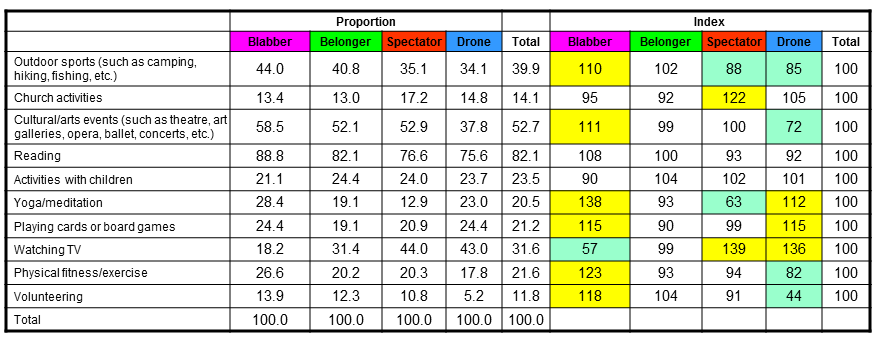
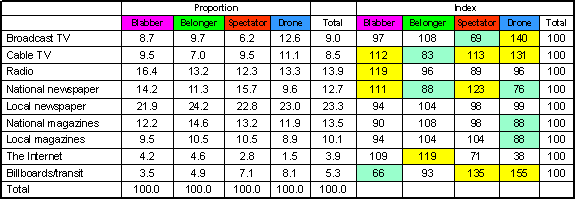
We are able to deepen and enrich our knowledge of the behaviors, demographics, psychographics, and media use of the different types by looking at indexed tables which are drawn directly from the segmentation analysis. Here are some examples of such tables:
In addition to presenting these indexed tables, we would also make certain to present tables and charts that illustrate:
- The size of each segment.
- Our brand’s penetration of each segment.
- The proportion of each type in a customer-only framework, a prospect-only framework, and a total-market framework.
- The degree of agreement/disagreement with key attitudinal statements that drive the composition of each segment.
Creative briefs
We would draft creative briefs for each segment resulting from the master typology, and we would make ourselves available to present those briefs to creative teams, discussing in detail their implications for communications strategy and the most effective way to approach each segment.
Media analysis
We would also prepare media-index tables of the kind that media planners typically use to prepare brand media plans. These tables would indicate which media the different types are most attentive to by:
- Demography
- Lifestyle/activity/area of interest
- Attitude
- Behavior toward the category and brand.
We would also make ourselves available to meet directly with media directors, planners, and buyers to discuss the implications of the tables for media planning and answer questions that help them with media planning.
Geographic analysis
We would also prepare a ranked opportunity list of DMA’s (or other appropriate territories) on the basis of the master brand typology. The list would be ranked by index of concentration, meaning that the highest would refer to places where the density of the best prospects is high and the lowest would refer to places where the density of the best prospects is low.
This form of analysis would also enable us to directly draw mailing lists from our national household database of prospects of different types in any area of the US.
Key contact at Cascade
For any follow-up questions you may have about the segmentation capabilities and experience of Cascade Strategies, please contact Mr. Jerry Johnson at (425) 677-7430 or jerry@cascadestrategies.com.


